How to use indigopy
Example code for how to use the indigopy package. The sample data used in this example notebook is derived from the INDIGO, INDIGO-MTB, and MAGENTA publications.
Set up environment
[1]:
# Import dependencies
import pandas as pd
from scipy.stats import spearmanr
from sklearn.metrics import r2_score, classification_report
from sklearn.ensemble import RandomForestClassifier, RandomForestRegressor
import seaborn as sns
import matplotlib.pyplot as plt

# Import package functions
from indigopy.core import load_sample, featurize, classify
Example: E. coli
The following analysis and results were originally reported in the INDIGO paper.
- Training dataset: 105 two-way interactions between 15 antibiotics
- Testing dataset: 66 two-way interactions between the 15 antibiotics in the training set + 4 new antibiotics
[2]:
# Load sample data
sample = load_sample('ecoli')

# Define input arguments
key             = sample['key']
profiles        = sample['profiles']
feature_names   = sample['feature_names']
train_ixns      = sample['train']['interactions']
train_scores    = sample['train']['scores']
test_ixns       = sample['test']['interactions']
test_scores     = sample['test']['scores']

# Determine ML features
train_data      = featurize(train_ixns, profiles, feature_names=feature_names, key=key, silent=True)
test_data       = featurize(test_ixns, profiles, feature_names=feature_names, key=key, silent=True)
X_train, X_test = train_data['feature_df'].to_numpy().transpose(), test_data['feature_df'].to_numpy().transpose()

# Determine class labels
thresh, classes = (-0.5, 2), ('S', 'N', 'A')
train_labels    = classify(train_scores, thresholds=thresh, classes=classes)
test_labels     = classify(test_scores, thresholds=thresh, classes=classes)

# Train and apply a regression-based model
reg_model = RandomForestRegressor()
reg_model.fit(X_train, train_scores)
reg_y = reg_model.predict(X_test)
r1, p = spearmanr(test_scores, reg_y)
r2 = r2_score(test_scores, reg_y)
print('Regression results:')
print('\tSpearman R = {}'.format(round(r1, 4)))
print('\tSpearman p = {:.3g}'.format(p))
print('\tR2 = {}'.format(round(r2, 4)))

# Train and apply a classification-based model
class_model = RandomForestClassifier()
class_model.fit(X_train, train_labels)
class_y = class_model.predict(X_test)
print('Classification results:')
print(classification_report(test_labels, class_y))
Defining INDIGO features: 100%|██████████| 105/105 [00:00<00:00, 219.56it/s]
Defining INDIGO features: 100%|██████████| 66/66 [00:00<00:00, 246.03it/s]
Regression results:
        Spearman R = 0.6567
        Spearman p = 2.14e-09
        R2 = 0.4017
Classification results:
              precision    recall  f1-score   support

           A       0.40      0.31      0.35        13
           N       0.69      0.88      0.77        42
           S       0.50      0.09      0.15        11

    accuracy                           0.64        66
   macro avg       0.53      0.43      0.42        66
weighted avg       0.60      0.64      0.58        66
Example: M. tuberculosis
The following analysis and results were originally reported in the INDIGO-MTB paper.
- Training dataset: 196 two- to five-way interactions between 40 antibacterials
- Testing dataset: 36 two- to three-way interactions between the 13 antibacterials
- Clinical dataset: clinical outcomes for 57 two- to five-way interactions between 7 antibacterials
[3]:
# Load sample data
sample = load_sample('mtb')

# Define input arguments
key             = sample['key']
profiles        = sample['profiles']
feature_names   = sample['feature_names']
train_ixns      = sample['train']['interactions']
train_scores    = sample['train']['scores']
test_ixns       = sample['test']['interactions']
test_scores     = sample['test']['scores']
clinical_ixns   = sample['clinical']['interactions']
clinical_scores = sample['clinical']['scores']

# Determine ML features
train_data      = featurize(train_ixns, profiles, feature_names=feature_names, key=key, silent=True)
test_data       = featurize(test_ixns, profiles, feature_names=feature_names, key=key, silent=True)
clinical_data   = featurize(clinical_ixns, profiles, feature_names=feature_names, key=key, silent=True)
X_train, X_test = train_data['feature_df'].to_numpy().transpose(), test_data['feature_df'].to_numpy().transpose()
X_clinical      = clinical_data['feature_df'].to_numpy().transpose()

# Determine class labels
thresh, classes = (0.9, 1.1), ('S', 'N', 'A')
train_labels    = classify(train_scores, thresholds=thresh, classes=classes)
test_labels     = classify(test_scores, thresholds=thresh, classes=classes)

# Train and apply a regression-based model
reg_model = RandomForestRegressor()
reg_model.fit(X_train, train_scores)
reg_y = reg_model.predict(X_test)
r, p = spearmanr(test_scores, reg_y)
r2 = r2_score(test_scores, reg_y)
print('Regression results:')
print('\tSpearman R = {}'.format(round(r, 4)))
print('\tSpearman p = {:.3g}'.format(p))
print('\tR2 = {}'.format(round(r2, 4)))

# Train and apply a classification-based model
class_model = RandomForestClassifier()
class_model.fit(X_train, train_labels)
class_y = class_model.predict(X_test)
print('Classification results:')
print(classification_report(test_labels, class_y))

# Apply model to clinical data
clinical_y = reg_model.predict(X_clinical)
r, p = spearmanr(clinical_scores, clinical_y)
print('Clinical results:')
print('\tSpearman R = {}'.format(round(-r, 4)))
print('\tSpearman p = {:.3g}'.format(p))
Defining INDIGO features: 100%|██████████| 196/196 [00:01<00:00, 194.83it/s]
Defining INDIGO features: 100%|██████████| 36/36 [00:00<00:00, 249.65it/s]
Defining INDIGO features: 100%|██████████| 57/57 [00:00<00:00, 248.65it/s]
Regression results:
        Spearman R = 0.5345
        Spearman p = 0.000785
        R2 = 0.0951
Classification results:
              precision    recall  f1-score   support

           A       0.67      0.38      0.48        16
           N       0.00      0.00      0.00         1
           S       0.67      0.84      0.74        19

    accuracy                           0.61        36
   macro avg       0.44      0.41      0.41        36
weighted avg       0.65      0.61      0.61        36

Clinical results:
        Spearman R = 0.4688
        Spearman p = 0.000235
Example: S. aureus
The following analysis and results were originally reported in the INDIGO paper.
- Training dataset: 171 two-way interactions between 19 antibiotics measured in E. coli
- Testing dataset: 45 two-way interactions between the 10 antibiotics measured in S. aureus
[4]:
# Load sample data
sample = load_sample('saureus')

# Define input arguments
key             = sample['key']
profiles        = sample['profiles']
feature_names   = sample['feature_names']
train_ixns      = sample['train']['interactions']
train_scores    = sample['train']['scores']
test_ixns       = sample['test']['interactions']
test_scores     = sample['test']['scores']
strains         = sample['orthology']['strains']
orthology_map   = sample['orthology']['map']

# Determine ML features
train_data      = featurize(train_ixns, profiles, feature_names=feature_names, key=key, silent=True)
test_data       = featurize(test_ixns, profiles, feature_names=feature_names, key=key, silent=True,
                            strains=strains, orthology_map=orthology_map)
X_train, X_test = train_data['feature_df'].to_numpy().transpose(), test_data['feature_df'].to_numpy().transpose()

# Determine class labels
thresh, classes = (-0.5, 2), ('S', 'N', 'A')
train_labels    = classify(train_scores, thresholds=thresh, classes=classes)
test_labels     = classify(test_scores, thresholds=thresh, classes=classes)

# Train and apply a regression-based model
reg_model = RandomForestRegressor()
reg_model.fit(X_train, train_scores)
reg_y = reg_model.predict(X_test)
r, p = spearmanr(test_scores, reg_y)
r2 = r2_score(test_scores, reg_y)
print('Regression results:')
print('\tSpearman R = {}'.format(round(r, 4)))
print('\tSpearman p = {:.3g}'.format(p))
print('\tR2 = {}'.format(round(r2, 4)))

# Train and apply a classification-based model
class_model = RandomForestClassifier()
class_model.fit(X_train, train_labels)
class_y = class_model.predict(X_test)
print('Classification results:')
print(classification_report(test_labels, class_y))
Defining INDIGO features: 100%|██████████| 171/171 [00:00<00:00, 225.88it/s]
Defining INDIGO features: 100%|██████████| 45/45 [00:00<00:00, 259.69it/s]
Mapping orthologous genes: 100%|██████████| 1/1 [00:01<00:00,  1.74s/it]
Regression results:
        Spearman R = 0.5862
        Spearman p = 2.33e-05
        R2 = -1.1969
Classification results:
              precision    recall  f1-score   support

           A       0.00      0.00      0.00         2
           N       0.49      1.00      0.66        22
           S       0.00      0.00      0.00        21

    accuracy                           0.49        45
   macro avg       0.16      0.33      0.22        45
weighted avg       0.24      0.49      0.32        45
c:\Users\carol\AppData\Local\Programs\Python\Python310\lib\site-packages\sklearn\metrics\_classification.py:1344: UndefinedMetricWarning: Precision and F-score are ill-defined and being set to 0.0 in labels with no predicted samples. Use `zero_division` parameter to control this behavior.
  _warn_prf(average, modifier, msg_start, len(result))
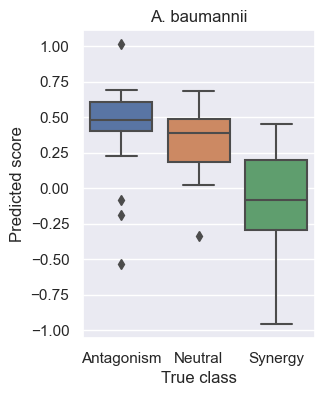
Example: A. baumannii
The following analysis and results were originally reported in the MAGENTA paper.
- Training dataset: 338 two- to three-way interactions between 24 antibiotics measured in E. coli cultured in various media conditions
- Testing dataset: 45 two-way interactions between the 8 antibiotics measured in A. baumannii
[5]:
# Load sample data
sample = load_sample('abaumannii')

# Define input arguments
key             = sample['key']
profiles        = sample['profiles']
feature_names   = sample['feature_names']
train_ixns      = sample['train']['interactions']
train_scores    = sample['train']['scores']
test_ixns       = sample['test']['interactions']
test_scores     = sample['test']['scores']
strains         = sample['orthology']['strains']
orthology_map   = sample['orthology']['map']

# Determine ML features
train_data      = featurize(train_ixns, profiles, feature_names=feature_names, key=key, silent=True)
test_data       = featurize(test_ixns, profiles, feature_names=feature_names, key=key, silent=True,
                            strains=strains, orthology_map=orthology_map)
X_train, X_test = train_data['feature_df'].to_numpy().transpose(), test_data['feature_df'].to_numpy().transpose()

# Determine class labels
thresh, classes = (-0.5, 0), ('S', 'N', 'A')
train_labels    = classify(train_scores, thresholds=thresh, classes=classes)
test_labels     = classify(test_scores, thresholds=thresh, classes=classes)

# Train and apply a regression-based model
reg_model = RandomForestRegressor()
reg_model.fit(X_train, train_scores)
reg_y = reg_model.predict(X_test)
r, p = spearmanr(test_scores, reg_y)
r2 = r2_score(test_scores, reg_y)
print('Regression results:')
print('\tSpearman R = {}'.format(round(r, 4)))
print('\tSpearman p = {:.3g}'.format(p))
print('\tR2 = {}'.format(round(r2, 4)))

# Train and apply a classification-based model
class_model = RandomForestClassifier()
class_model.fit(X_train, train_labels)
class_y = class_model.predict(X_test)
print('Classification results:')
print(classification_report(test_labels, class_y))

# Visualize results
df = pd.DataFrame({'x': test_labels, 'y': reg_y})
df.replace({'A': 'Antagonism', 'N': 'Neutral', 'S': 'Synergy'}, inplace=True)
sns.set(rc={'figure.figsize':(3, 4)})
ax = sns.boxplot(x='x', y='y', data=df, order=['Antagonism', 'Neutral', 'Synergy'], )
ax.set(title='A. baumannii', xlabel='True class', ylabel='Predicted score')
plt.show()
Defining INDIGO features: 100%|██████████| 338/338 [00:01<00:00, 230.37it/s]
Defining INDIGO features: 100%|██████████| 45/45 [00:00<00:00, 263.42it/s]
Mapping orthologous genes: 100%|██████████| 1/1 [00:02<00:00,  2.51s/it]
Regression results:
        Spearman R = 0.6627
        Spearman p = 7.07e-07
        R2 = -0.2489
Classification results:
              precision    recall  f1-score   support

           A       0.43      0.94      0.59        17
           N       0.50      0.09      0.15        11
           S       0.83      0.29      0.43        17

    accuracy                           0.49        45
   macro avg       0.59      0.44      0.39        45
weighted avg       0.60      0.49      0.43        45
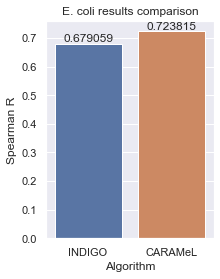
Extension to CARAMeL: using metabolic flux data as drug profiles
The following example shows how to use metabolic flux data to define the drug profiles, which was introduced in our CARAMeL algorithm. Here we re-run the E. coli example using already saved and normalized metabolic flux data (
ecoli_flux_normalized.csv), which was simulated using the COBRA Toolbox in MATLAB. Please refer to the CARAMeL
publication for further details.- Training dataset: 105 two-way interactions between 15 antibiotics
- Testing dataset: 66 two-way interactions between the 15 antibiotics in the training set + 4 new antibiotics
[6]:
# Load sample data
sample = load_sample('ecoli')

# Define input arguments
key             = sample['key']
train_ixns      = sample['train']['interactions']
train_scores    = sample['train']['scores']
test_ixns       = sample['test']['interactions']
test_scores     = sample['test']['scores']

# Define drug profile information
df              = pd.read_csv('ecoli_flux_normalized.csv')
profiles        = df.loc[:, ~df.columns.isin(['rxn', 'rxnName', 'subSystem'])].to_dict('list')
feature_names   = df['rxn'].tolist()

# Determine ML features
train_data      = featurize(train_ixns, profiles, feature_names=feature_names, key=key, silent=True)
test_data       = featurize(test_ixns, profiles, feature_names=feature_names, key=key, silent=True)
X_train, X_test = train_data['feature_df'].to_numpy().transpose(), test_data['feature_df'].to_numpy().transpose()

# Determine class labels
thresh, classes = (-0.5, 2), ('S', 'N', 'A')
train_labels    = classify(train_scores, thresholds=thresh, classes=classes)
test_labels     = classify(test_scores, thresholds=thresh, classes=classes)

# Train and apply a regression-based model
reg_model = RandomForestRegressor()
reg_model.fit(X_train, train_scores)
reg_y = reg_model.predict(X_test)
r, p = spearmanr(test_scores, reg_y)
r2 = r2_score(test_scores, reg_y)
print('Regression results:')
print('\tSpearman R = {}'.format(round(r, 4)))
print('\tSpearman p = {:.3g}'.format(p))
print('\tR2 = {}'.format(round(r2, 4)))

# Train and apply a classification-based model
class_model = RandomForestClassifier()
class_model.fit(X_train, train_labels)
class_y = class_model.predict(X_test)
print('Classification results:')
print(classification_report(test_labels, class_y))

# Visualize compare INDIGO vs. CARAMeL
df = pd.DataFrame({'Algorithm': ['INDIGO', 'CARAMeL'], 'Spearman R': [r1, r]})
sns.set(rc={'figure.figsize':(3, 4)})
ax = sns.barplot(x='Algorithm', y='Spearman R', data=df, order=['INDIGO', 'CARAMeL'])
ax.set(title='E. coli results comparison')
ax.bar_label(ax.containers[0])
plt.show()
Defining INDIGO features: 100%|██████████| 105/105 [00:00<00:00, 254.06it/s]
Defining INDIGO features: 100%|██████████| 66/66 [00:00<00:00, 313.73it/s]
Regression results:
        Spearman R = 0.657
        Spearman p = 2.09e-09
        R2 = 0.3973
Classification results:
              precision    recall  f1-score   support

           A       0.54      0.54      0.54        13
           N       0.69      0.83      0.75        42
           S       0.50      0.09      0.15        11

    accuracy                           0.65        66
   macro avg       0.57      0.49      0.48        66
weighted avg       0.63      0.65      0.61        66